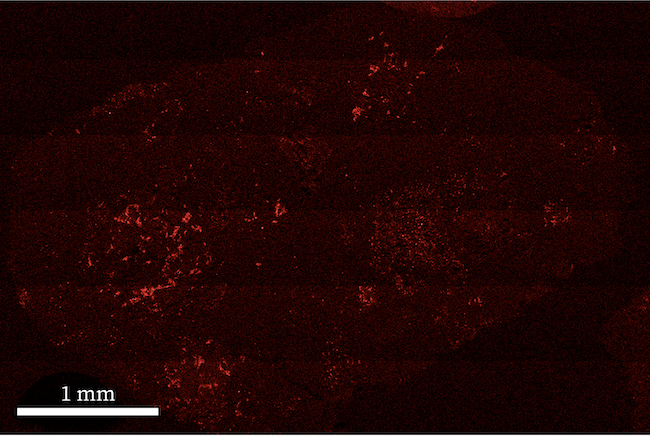
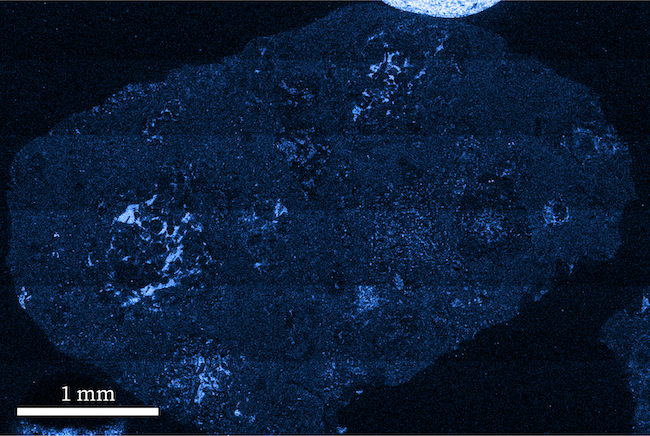
Backscattered electron (BSE) images and the EDS Na (red) and Al (blue) maps of the control sample. The Na and Al maps for the control and the heated chips were plotted on the same intensity scale to enable direct comparison. This interactive figure shows an overlay of the Na and Al maps, with a slidebar allowing the viewer to change between them. Viewers can click and drag the gray dot to change between the two maps.