Usage:
Sliders filter the objects on the graph above.
Selecting an optical depth category in the legend displays only objects in the selected category.
Hover with a mouse pointer on the symbols to view information about each object.
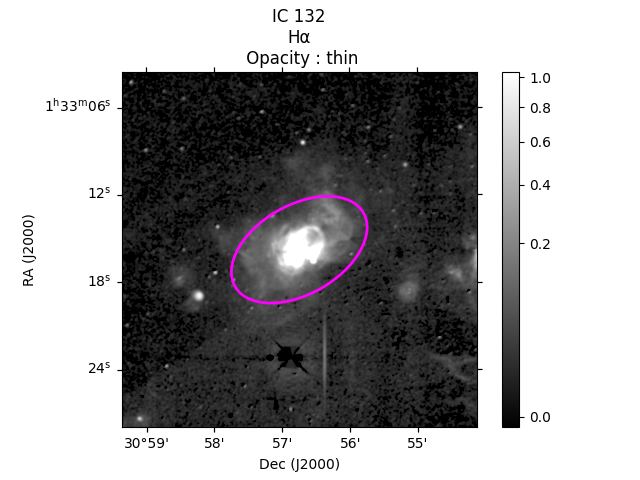
Display a ratio map using the dropdown menu or by selecting an object on the graph.
Radio buttons change the ratio map shown below.